
Archive post: Universal Jobmatch was replaced by Find a job on 14 May 2018.
Have you tried to use Universal Jobmatch to access data on job vacancies? If so, you may have been shocked and dismayed by what you found.![]()
Universal Jobmatch (UJ) is intended to be a “new best of breed online service” for jobseekers and employers, intended to transform DWP’s labour market services, automatically matching jobseekers to jobs based on their skills and CV. It is run by Monster, on a £15m contract over four years. It is a potentially very valuable source of data, and the contract specification included requirements for LMI summary tools. UJ data replaced those from the Jobcentre Plus notification system which ceased in November 2012, and was expected by the Department of Work and Pensions to provide a more comprehensive picture and offer improvements in how the data can be accessed and used. Possible UJ analyses include vacancies by industry and occupation; numbers of employers with vacancies; and qualification levels amongst jobseekers and levels required by employers.
However, closer examination of UJ raises many concerns, several of which have recently surfaced on the Labour Market Statistics Group on StatsUserNet. The serious deficiencies are very unfortunate at a time when there are increasing concerns about skills mismatches, the quality of jobs and careers advice, and LEPs working with partners on skills strategies and local EU growth programmes.
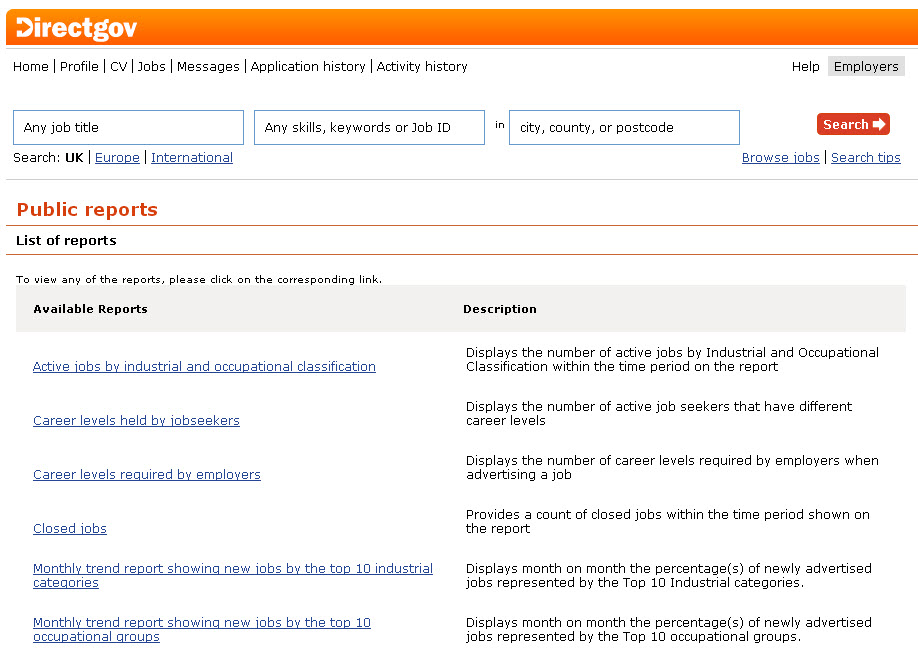
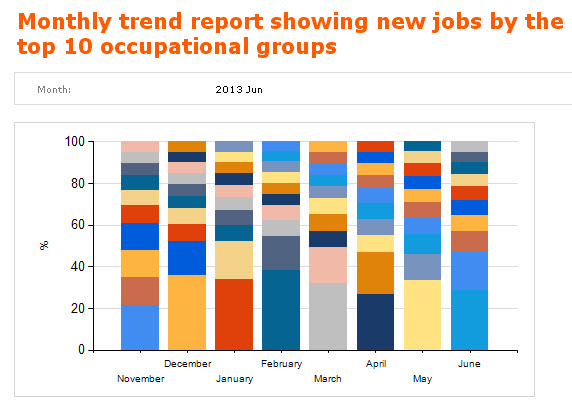
First, there are issues about how the UJ statistical reports function works – with no guidance and descriptions of the data (metadata) provided. Drop down menus for local authority areas stop part way through the alphabet (tough if you’re after East Devon on one and Kingston upon Thames on another). You can derive top ten rankings, eg, for occupational groups – which generates a bar chart where you need to hover your cursor to see what the bars contain. You have the option to download into Excel, and all this provides is a picture and no data.
 Secondly, UJ does not use conventional classifications, for geography, industry or occupation. The contract spec for UJ expected the use of Standard Industrial and Standard Occupational Classification (SIC & SOC) codes, but UJ currently uses Monster’s own taxonomy. Monster’s US origins are evident in the report on qualifications held by jobseekers where ‘Some High School Coursework’ and ‘High School or equivalent’ are categories. User interfaces are, however, tailored to Britain: when employers post vacancies, they are asked to select job location regions, though these correspond more to ITV broadcasting (Anglia, Tyne-Tees, etc) rather than administrative regions. Analysis of the industry breakdown of vacancies is made problematic by the high proportion which feature under ‘Staffing/Employment Agencies’, rather than the sector concerned. Looking at data for Hertfordshire in March, for instance, showed 55% of all vacancies in this category.
Thirdly, UJ is typically capturing a different profile of vacancies than the previous JCP system, with many more managerial and professional posts and many fewer low skill or no skill vacancies. There are also oddities which seem difficult to explain: the StatsUserNet discussion, for instance, commented on numbers of vacancies for ‘diplomats’ in the Tees Valley and Cumbria.
It’s important to understand how the new system works, combining as it does posts entered by employers, bulk uploads from ‘job warehouse’ sites, and other vacancies ‘scraped’ (by agreement) from the Internet. In this, there is relevant learning to be gained from the USA, where the Department of Labor has supported projects which made use of data using online job postings for real-time LMI. This experience offers a good number of warnings, for instance about the likelihood of duplicated postings, under-representation of jobs in smaller companies and in rural areas, and of variations by sector, locality and level of geographic analysis.
It’s sad that DWP and Monster have not adopted a more open and inviting approach to improving the site – it’s far from co-design principles that get the best out of interactive websites. In the August 2012 DWP Quarterly Statistical Summary, there was an article which explained DWP’s new approach to vacancy statistics, inviting comments and referring to a six-month beta stage.
There was a statement in Parliament (Hansard, 4 June 2013) that DWP and Monster had a timetable for prioritising and implementing improvements, but this had not been made public.
Finally, while these are gripes from a labour market analysis perspective, spare a thought for jobseekers. It’s not difficult to find criticisms of how the system works for them. It’s very serious: Jobseekers Allowance claimants could be required to look for work using Universal Jobmatch , or risk losing their benefit.